Simulation Manual: Phase Difference Between Sound Waves
Are you interested in translating this manual into another language? Please contact me here.
Para leer la versión en español, haga clic aquí.
Introduction
With this rich simulation, you can visualize and measure the phase difference between two sound waves using two microphones connected to an oscilloscope. Moreover, you can determine the speed of sound in air by measuring the distance between the two microphones when their waveforms are in phase, taking into account the frequency of the sound wave that is controlled by the sine wave generator.
Click here to run the simulation.
Target Users
This simulation is instrumental and informative for students who want to virtually perform the experiment without the need for a real lab (or in the case of lab equipment shortage). They can record measurements of several physical quantities such as the phase shift between the two waveforms, the wavelength of the sound wave, and the frequency of the sound wave, and from these results, they can determine the speed of sound in air. The ambient temperature of this experiment is between 25ºC and 30ºC.
The simulation is also invaluable and handy for teachers and lab instructors who want to engage their students in performing lab activities on sound and draw conclusions and discover the underlying principles.
I advise the instructors who want to benefit from this simulation to introduce the experiment in a directed discovery approach. This way, the students are guided through repeating the experiment to discover the underlying principles rather than receiving them.
Importance of the Simulation
Setting up experiments to visualize sound waves on an oscilloscope is intricate and can be expensive. Its equipment is not easily found in every school lab. So, this simulation makes it easy for high-school and undergraduate students to perform an affordable activity that enables them to acquire the required skills and knowledge in this topic.
Of course, it is much better to perform a real experiment when possible. However, the virtual experiment is much appreciated in the case of a shortage of equipment or for a preliminary activity to prepare the students for the real lab.
Instructional designers and course creators may find that this simulation facilitates their work.
Sound Waves and the Speed of Sound
Definitions
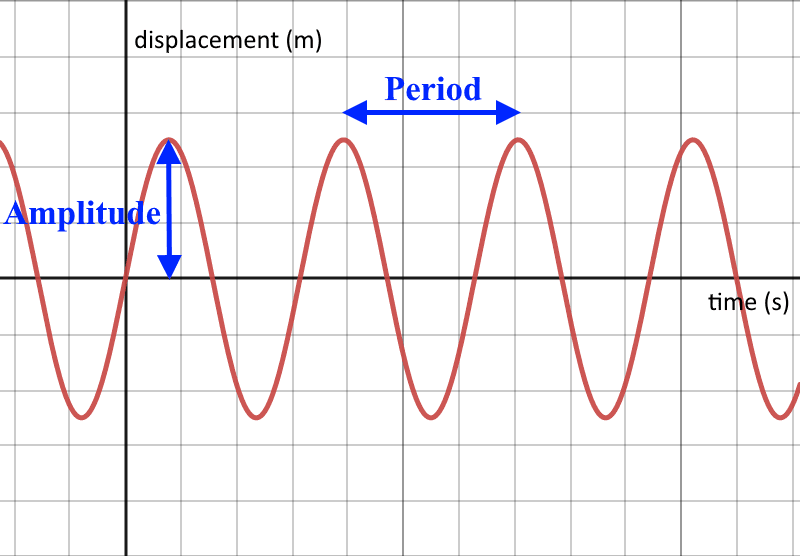
The period: is the time taken for one complete cycle of vibration to pass a given point on the wave. Its base SI unit is the second.
The frequency: is the number of wave crests that pass a point in one second (a wave crest is the peak of the wave). Its base SI unit is the hertz.
The amplitude: is the maximum displacement moved by a point on a wave measured from its equilibrium position.
The following figure illustrates the concept of the period and the amplitude.
The wavelength: is the length of the shortest repeating part of the wave, as shown in the following figure.
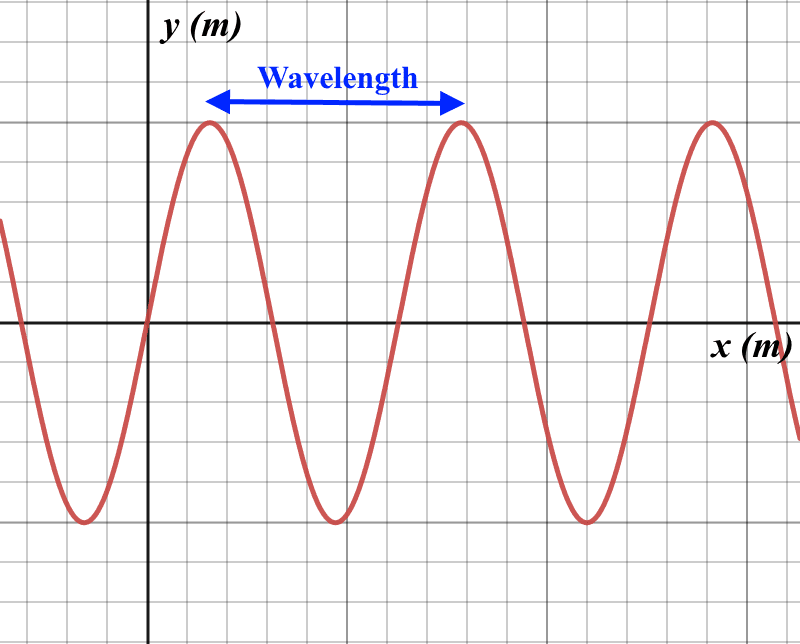
Important note: The previous two figures are completely different graphs. The first represents the variations of the amplitude as a function of time, while the second represents the variations of the displacement as a function of position.
The phase of a point on a wave: is the fraction of a period that a point completes after last passing through the reference.
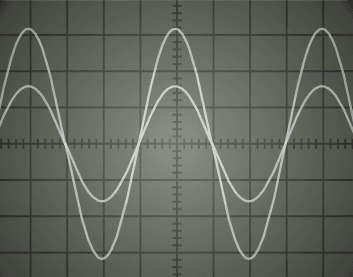
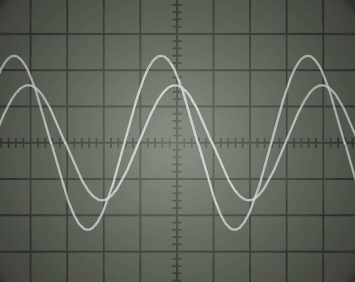
In phase: Two waves of the same frequency are in phase when they are perfectly aligned, that is, when the crests or the troughs of the two waves happen at the same instants of time. The following figure illustrates this concept.
Out of phase: If two waves are not in phase, they are said to be out of phase. The following figure illustrates this concept.
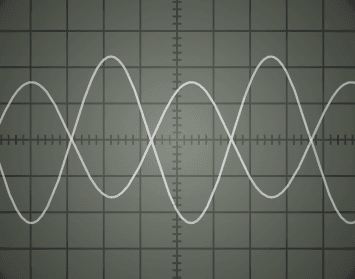
In antiphase: Two waves of the same frequency are said to be in antiphase when the crests of one happen at the same instant as the troughs of the other, as shown in the following figure.
Calculating the Phase Difference φ Between Two Waveforms on the Oscilloscope
One of the usages of this simulation is to practice determining the phase difference between two waveforms on the screen of the oscilloscope. The following figure illustrates this concept.
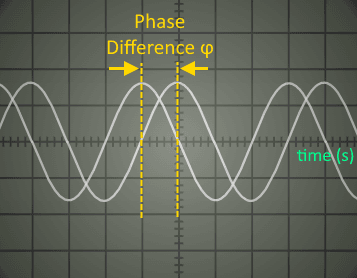
First measure the shift (the number of divisions X) between the two waveforms on the x-axis, its unit is in divisions (div). Also, measure the length of one period in divisions (T). Bear in mind that a one-period time difference corresponds to an angular phase difference of 2 rad. So:
![\[T\ (div) \rightarrow 2\pi\ (rad)\]](https://physics-zone.com/wp-content/ql-cache/quicklatex.com-425267ab69a58a26a9d45a25a125d2d8_l3.svg "Rendered by QuickLaTeX.com")
![\[\text{X\ }\left( \text{div} \right) \rightarrow \phi\ (rad)\]](https://physics-zone.com/wp-content/ql-cache/quicklatex.com-6ae2af6200cd2a3155fa3f1a247b58e8_l3.svg "Rendered by QuickLaTeX.com")
By cross multiplication, we conclude that:
![\[\phi = \frac{X}{T}\ \cdot 2\pi\ (rad)\]](https://physics-zone.com/wp-content/ql-cache/quicklatex.com-649567610468fadcad6d5bb676b9f3a4_l3.svg "Rendered by QuickLaTeX.com")
Determining the Speed of Sound in Air
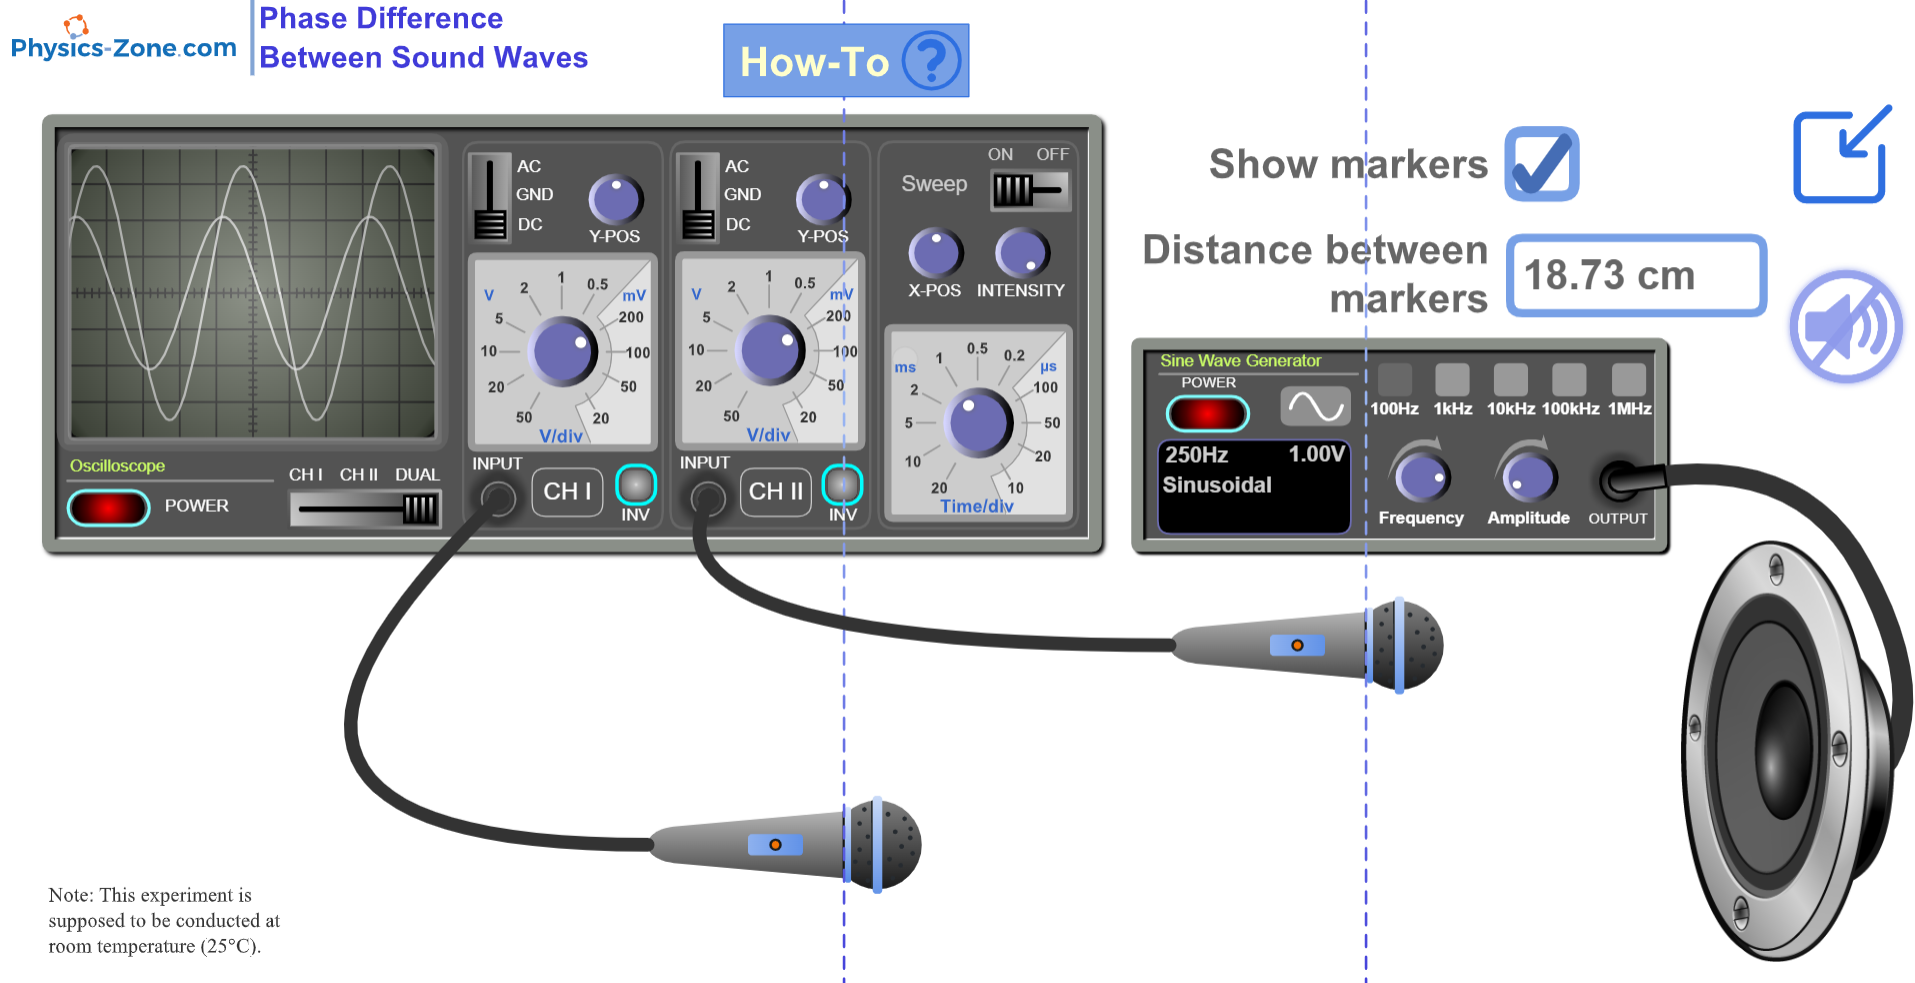
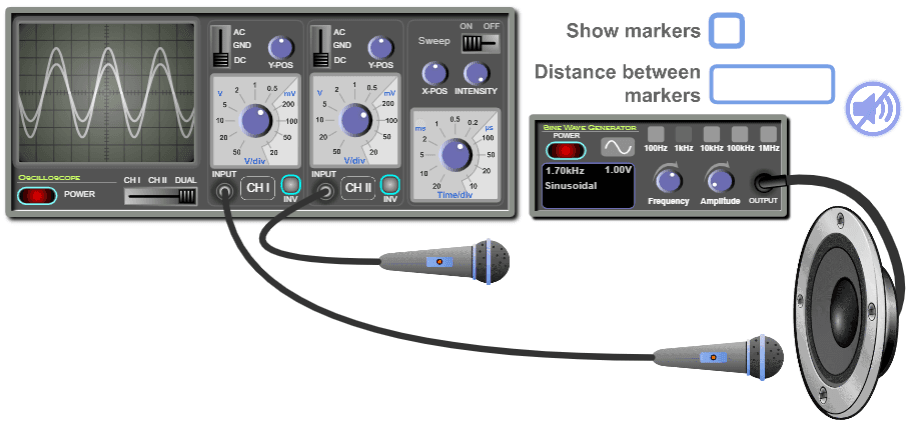
An application of this simulation is to find the speed of sound in air. The equipment used is an oscilloscope, sine wave generator, loudspeaker, and two microphones.
As shown in the following figure, the loudspeaker is connected to the output of the sine wave generator, and the two microphones are connected to the two input channels of the oscilloscope. The sine wave generator feeds the loudspeaker with a sine wave electrical signal, so the loudspeaker converts this electrical signal into a sound wave. This sound wave is called “pure sound” since it is monotonic. The two microphones receive the sound emitted by the loudspeaker and convert it into electrical signals that are input to the channels of the oscilloscope.
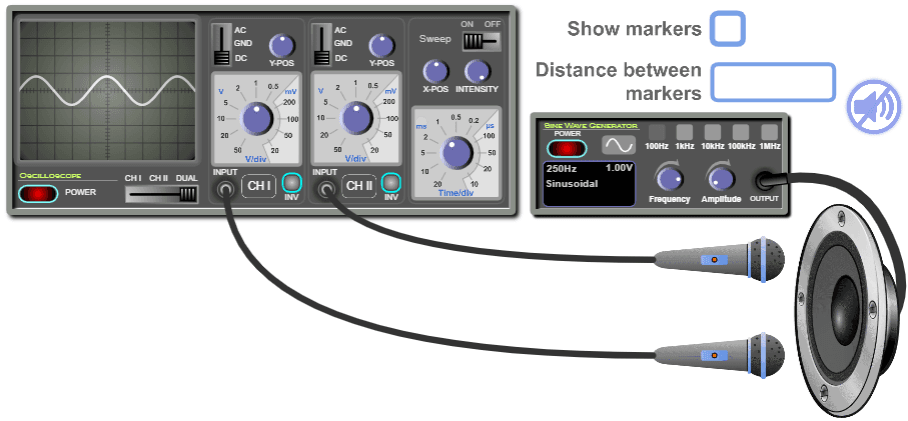
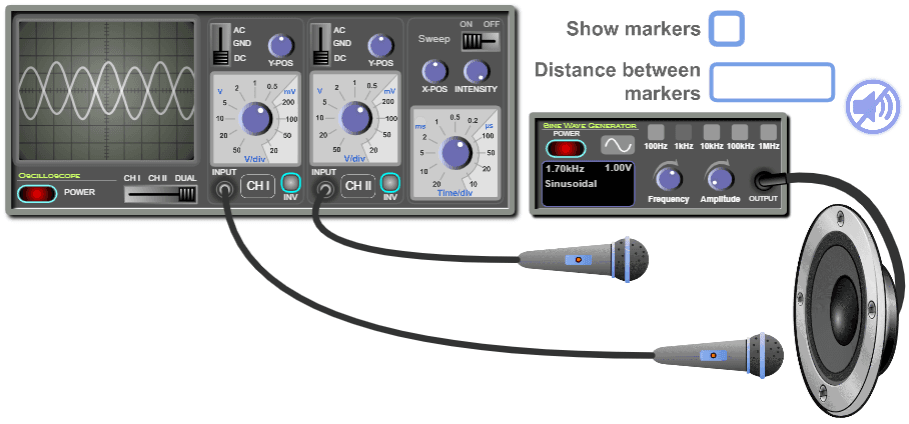
The two input signals are displayed on the screen of the oscilloscope simultaneously when you select the “Dual” mode on the oscilloscope. Initially, the two microphones are at the same distance from the loudspeaker, so the sound waves they receive are in phase, and so are their waveforms on the screen of the oscilloscope. When you move one of the microphones, you will notice that the amplitude of the related waveform decreases as you move the microphone away since the sound it receives becomes weaker. But what matters is that the related waveform shifts horizontally on the screen, so there becomes a phase difference between the two waveforms and they are said to be out of phase. Move the microphone furthermore until the two waveforms become in phase again for the first time, as shown in the following figure. At this point, the distance between the two microphones is equal to the wavelength of the sound wave they receive. Measure this distance and multiply it by the frequency of the sound wave (which is the frequency given by the sine wave generator) and you will get the speed of sound. Mathematically:
![\[v = \lambda \cdot f\]](https://physics-zone.com/wp-content/ql-cache/quicklatex.com-b818493bbeed4fb1575c1e880d07ed0c_l3.svg "Rendered by QuickLaTeX.com")
where  is the speed of sound,
  is the wavelength of the sound wave, and
  is the frequency of the sound wave.
If you furthermore move the microphone until the two waveforms become in phase for the second time, then the distance between the two microphones is twice the wavelength, and so on. Mathematically:
![\[d_{\text{inphase}} = k \cdot \lambda\]](https://physics-zone.com/wp-content/ql-cache/quicklatex.com-037188d553ea2bcaf2f44a7b83c384db_l3.svg "Rendered by QuickLaTeX.com")
where  is an integer.
Alternatively, you can move one microphone until the waveforms become in antiphase for the first time, as shown in the following figure. In this case, the distance between the two microphones is half the wavelength. You must multiply it by two to obtain the wavelength.
Moreover, if you move the microphone furthermore until the waveforms become in antiphase for the second time, then the distance between the two microphones is three halves the wavelength, and so on. Mathematically:
![\[d_{\text{antiphase}} = \left( 2k + 1 \right) \cdot \frac{\lambda}{2}\]](https://physics-zone.com/wp-content/ql-cache/quicklatex.com-930a79812dd4fd169e7f1fdec25d3da2_l3.svg "Rendered by QuickLaTeX.com")
where is an integer.
Of course, there are other experiments with a different set of equipment to measure the speed of sound in air.
Working Guidelines for the Simulation
In this section, we are going through each element of the simulation and explaining its function.
General Controls
Maximize / Minimize toggle button: Click on this button to enter full-screen mode or to restore the window mode.

Sound mute toggle button: Click this button to toggle sound OFF/ON.

Show Markers: Tick this check button to enable the visibility of the vertical markers. When you want to measure the horizontal distance between the two microphones, drag these markers and place one at one microphone and the other at the other microphone, and the distance between the two microphones will be displayed inside the textbox labeled “Distance between markers”.

Distance between markers: This box displays the distance between the vertical markers.
![]()
Sine Wave Generator
Sine Wave Generator: This instrument supplies a sine wave electrical signal. The signal is input to the loudspeaker via connecting wires. Note that you must turn it on to operate the loudspeaker.
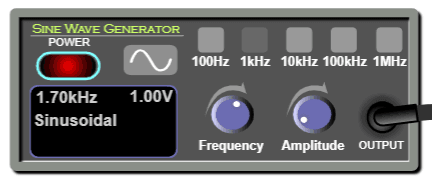
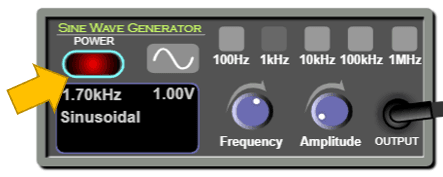
ON/OFF switch: This is used to turn on or off the Sine Wave Generator.
Frequency knob: You can rotate this knob to vary the value of the frequency.
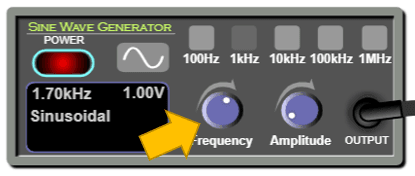
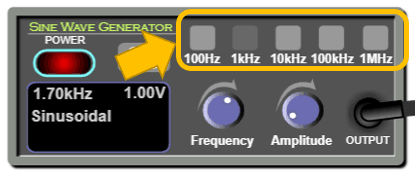
Frequency ranges: You can select a range so you vary the frequency accordingly using the frequency knob.
Amplitude knob: You can rotate this knob to vary the value of the amplitude of the signal.

Loudspeaker and Microphones
Loudspeaker: This instrument receives the electrical signal from the sine wave generator and converts it into a sound signal.

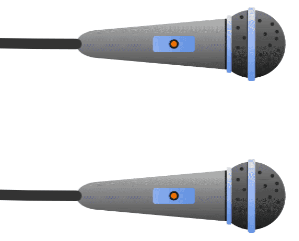
Microphones: These are used to receive the sound emitted by the loudspeaker. Note that you can drag them.
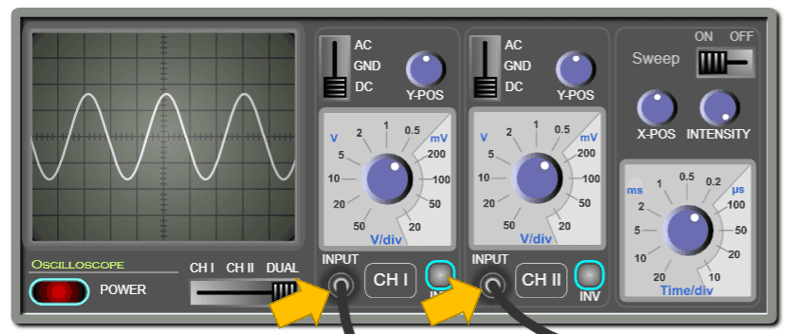
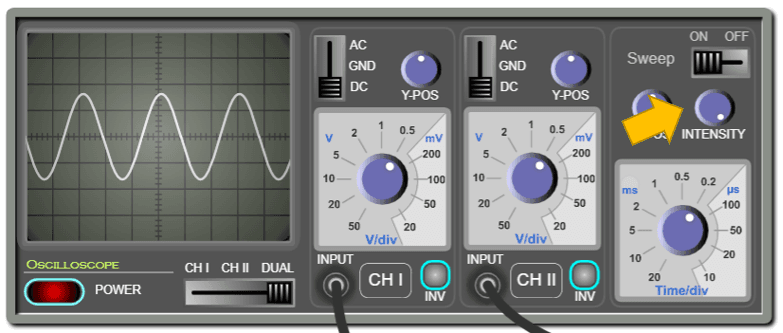
Oscilloscope
Oscilloscope: used for visualizing electrical signals.
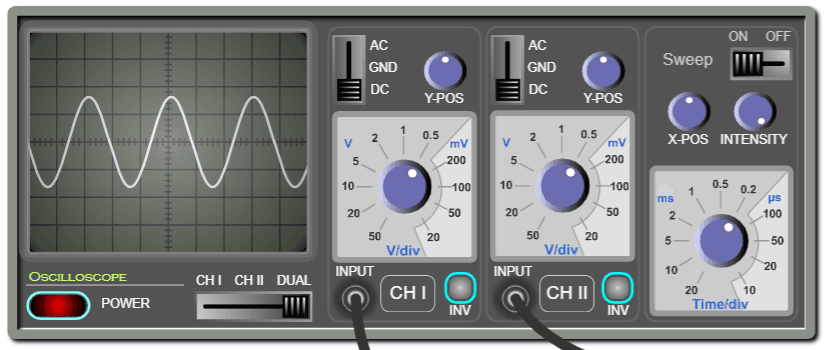
ON/OFF switch: This is used to turn on or off the oscilloscope.
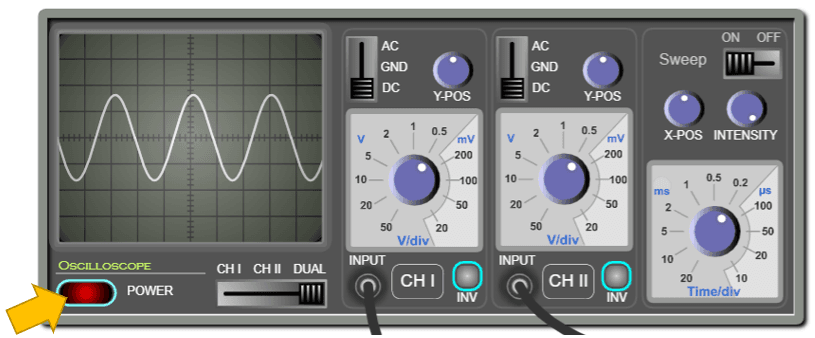
The screen of the oscilloscope: is where the input signals are displayed. The displayed signals are “waveforms”. The vertical axis represents the voltage and the horizontal axis represents the time. Note that the screen is divided into squares. Each square is a division “div”. Each division is divided into five subdivisions. So each subdivision equals 0.2 div.
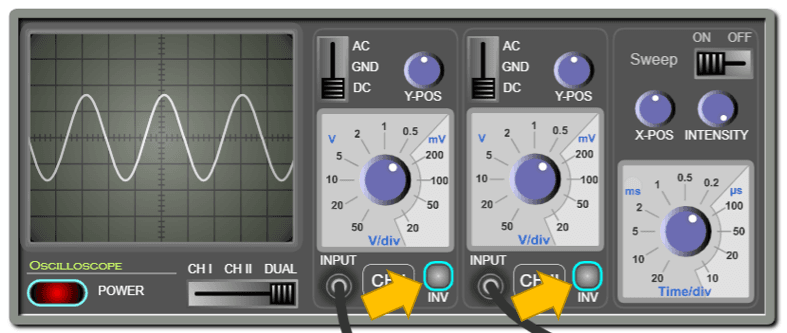
Channel selector: this is used to select the input to be displayed on the screen.
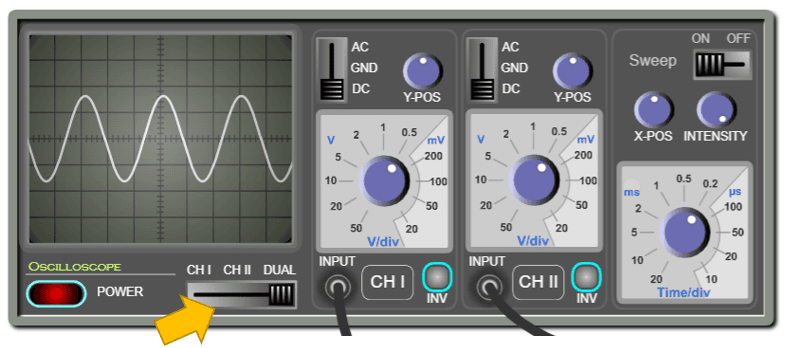
Channel I & Channel II: The oscilloscope has two inputs and can trace the two input signals simultaneously or separately.
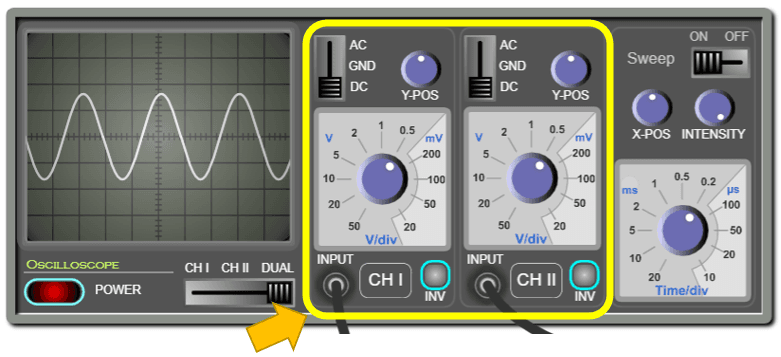
Inputs: Each channel has an input where you can connect the probe.
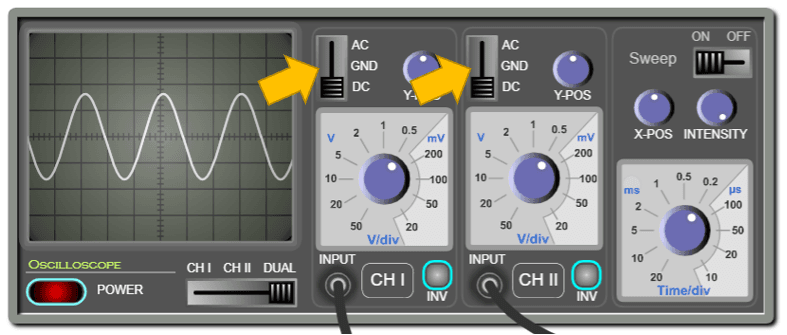
AC/DC/GND Selector: When this is set to “AC”, the DC part of the signal is filtered out. When the selector is set to ground “GND”, the screen will display zero volts. This is used for calibrating the zero level of the display. When the selector is set to “DC”, the entire signal will be displayed.
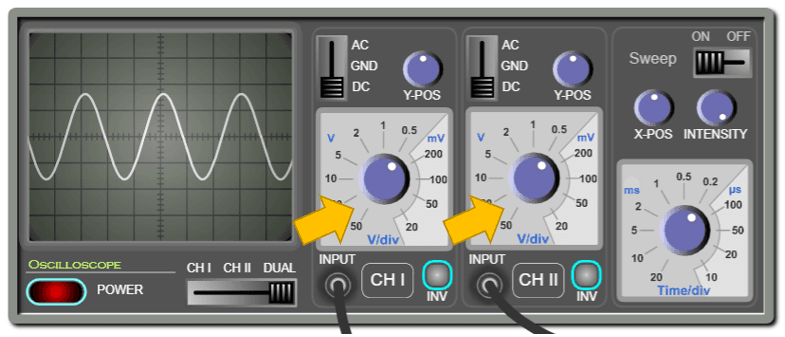
Vertical sensitivity: Each channel has its own vertical sensitivity, which is the scale to which the input signal is traced on the screen. In other words, it determines how many volts are represented in a vertical division.
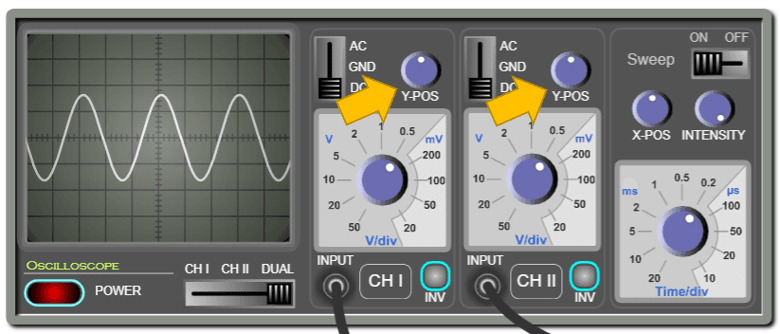
Y-Position: Each channel has a knob for displacing the signal upwards or downwards. This is useful in the measurements and comparison of signals.
Invert button: This is used to invert (flip) the signal vertically.
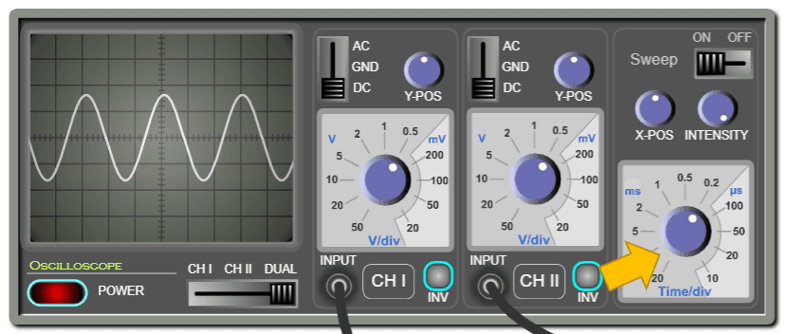
Horizontal sensitivity (Time base): Use this knob to change the time scale on the horizontal axis. In other words, this determines how many milliseconds or microseconds are represented in a horizontal division.
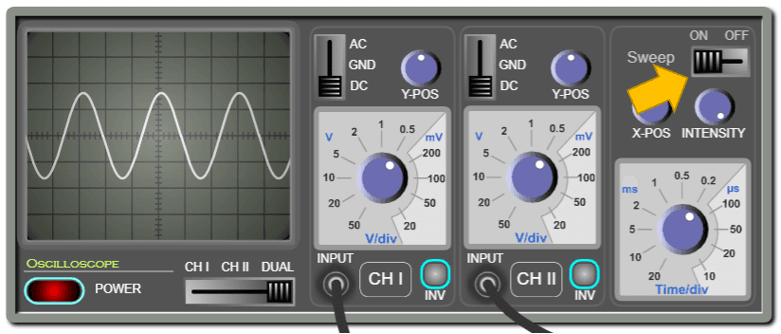
Sweep button: this is used to turn ON/OFF the sweeping. If the sweep is OFF, the screen will display a luminous dot. Otherwise, it will display a curve.
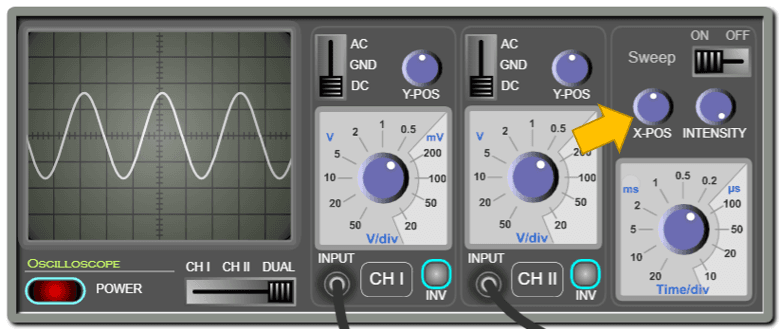
X-position: Use this knob to displace the waveform horizontally to the left or the right. This is useful in measurement.
Intensity: Use this knob to control the intensity of the luminous lines displayed on the screen.
Conclusion
With this simulation, which is rich in controls and visuals, the learner can observe and practice measuring the phase difference between two waveforms on the oscilloscope. They can also determine the speed of sound in air. With the proper instructional methodologies, the instructor will be able to empower the sense of discovery in the learners and introduce the concept of synchronization of sound waves and how to measure the speed of sound in a clear and visually rich presentation, enabling the learners to acquire the required learning objectives.
It is worth mentioning that this simulation is coded with the latest HTML5/JavaScript web tools.