
Phase Difference Between Sound Waves: Rebuilt with New Features
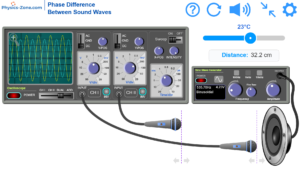
The Phase Difference Between Sound Waves simulation has been rebuilt from the ground up, with new tools that make it more realistic and easier to use in class.
What’s new
- One or two microphones – start with a single microphone to see how a sound wave appears on an oscilloscope, then add the second to measure phase differences.
- Exact measurements – the measurement markers snap to the microphone tips for a precise distance reading.
- Upgraded oscilloscope – DUAL and ADD modes, plus a magnifier whose semi-transparent screen keeps the controls beneath it usable.
- Temperature control – set the air temperature from 0 °C to 40 °C and the speed of sound follows.
- Guided tour – a step-by-step introduction with live demonstrations on the instruments.
Looking for another method? Pair it with Measuring the Speed of Sound: Time-of-Flight and let students compare two independent measurements of the same quantity.
The temperature control is the part worth thinking about, since speed of sound changes roughly 0.6 m/s per degree Celsius, so a phase reading taken at 20 C won’t match one at 30 C. A useful check before students compare results: have them record the temperature setting alongside each phase measurement, then recompute the expected wavelength from that value rather than assuming a fixed speed. That makes the two-method comparison meaningful instead of just two numbers that happen to disagree.