Simulation Manual: Virtual Oscilloscope
Are you interested in translating this manual into another language? Please contact me here.
To download this manual in pdf format click here.
Introduction:
With this rich simulation, you can visualize and measure the phase difference between two sound waves using two microphones connected to an oscilloscope. Moreover, you can determine the speed of sound in air by measuring the distance between the two microphones when their waveforms are in phase, taking into account the frequency of the sound wave that is controlled by the sine wave generator.

The target users:
This simulation is instrumental and informative for students who want to virtually experiment without the need for a real lab (or in the case of lab equipment shortage). They can record measurements of several physical quantities such as the period, the maximum voltage, and the phase shift between the two waveforms, etc.., and from these results, they can determine other quantities like the effective voltage and the frequency.
The simulation is also invaluable and handy for teachers and lab instructors who want to engage their students in performing lab activities on sound and draw conclusions and discover the underlying principles.
I advise the instructors who want to benefit from this simulation to introduce the experiment in a directed discovery approach. This way, the students are guided through repeating the experiment to discover the underlying principles rather than receiving them.
Importance of the simulation:
The most important aspect of this simulation is that it gives the chance to the learner to get used to intricate and expensive equipment like the oscilloscope, the low frequency generator, and the DC power supplies. This equipment is not easily found in every school lab. So, this simulation makes it easy for high-school and undergraduate students to perform an affordable activity that enables them to acquire the required skills and knowledge in this topic.
Of course, it is much better to perform a real experiment when possible. However, the virtual experiment is much appreciated in the case of a shortage of equipment or for a preliminary activity to prepare the students for the real lab.
Instructional designers and course creators may find that this simulation facilitates their work.
A short introduction to the equipment in the simulation:
The oscilloscope is a device to visualize the variations of the electrical signals as functions of time. It is used to determine characteristics of the signals such as the maximum voltage, the effective voltage, the period, and the frequency. It also enables the comparison of two signals and determining the phase difference between them.

On the other hand, the Low frequency generator generates periodic electrical signals such as sinusoidal, triangular, and rectangular signals. It contains controls to vary the frequency, the amplitude (the maximum voltage), and the DC shift. A DC offset is a constant voltage value added to the signal.
The DC power supply is a voltage source that provides constant voltage. It contains controls to vary the value of the voltage, and the maximum current, which is the limit value it delivers. This is useful for safety measures.
Working guidelines for the simulations:
In this section, we are going through each element of the simulation and explaining its
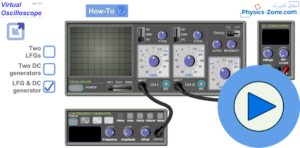
Maximize / Minimize toggle button: Click on this button to enter full-screen mode or to restore the window mode.

Two LFGs: Tick this check button to connect two LFGs (Low Frequency Generators) to the oscilloscope.

Two DC generators: Tick this check button to connect two DC power supplies to the oscilloscope.

LFG & DC generator: Tick this check button to connect a Low Frequency Generator and a DC power supply to the oscilloscope (Default choice).

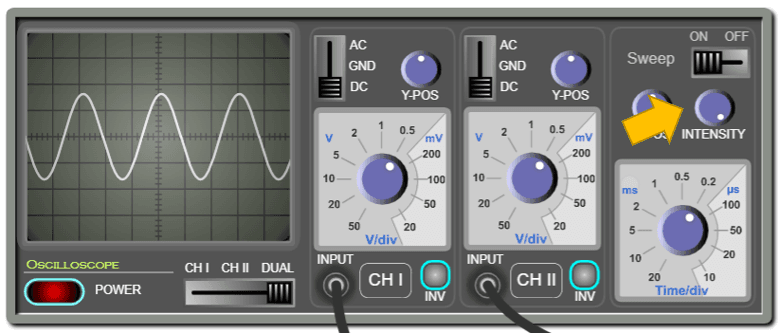
Oscilloscope: used for visualizing electrical signals.
ON/OFF switch: This is used to turn on or off the oscilloscope.
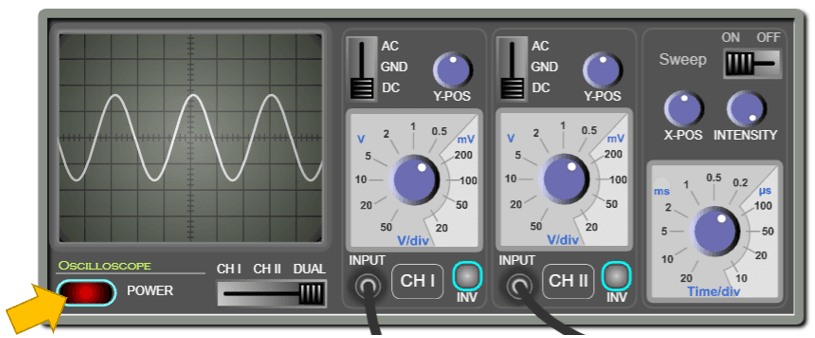
The screen of the oscilloscope: is where the input signals are displayed. The displayed signals are “waveforms”. The vertical axis represents the voltage and the horizontal axis represents the time. Note that the screen is divided into squares. Each square is a division “div”. Each division is divided into five subdivisions. So, each subdivision equals 0.2 div.

Channel selector: this is used to select the input to be displayed on the screen.
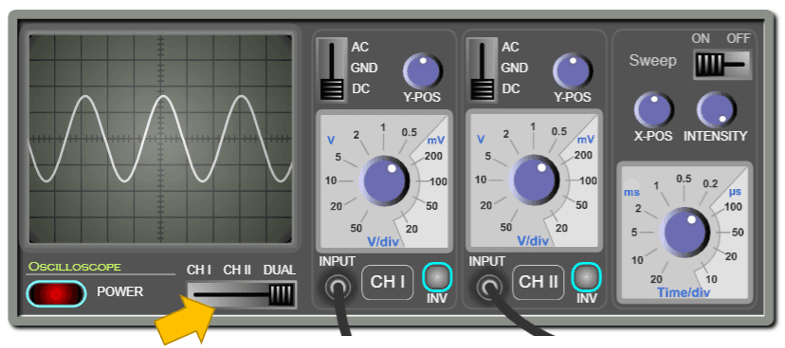
Channel I & Channel II: The oscilloscope has two inputs and can trace the two input signals simultaneously or separately.
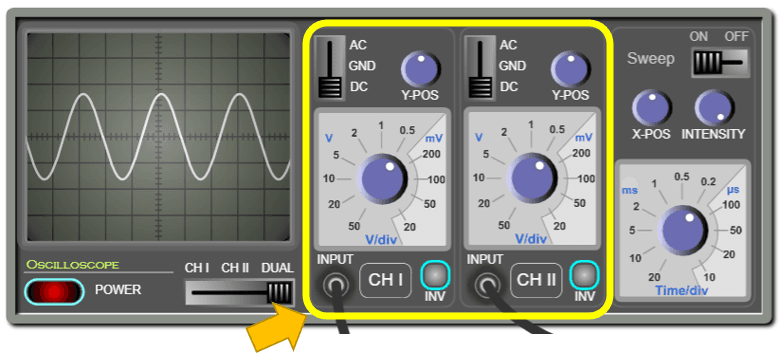
Inputs: Each channel has an input where you can connect the probe.
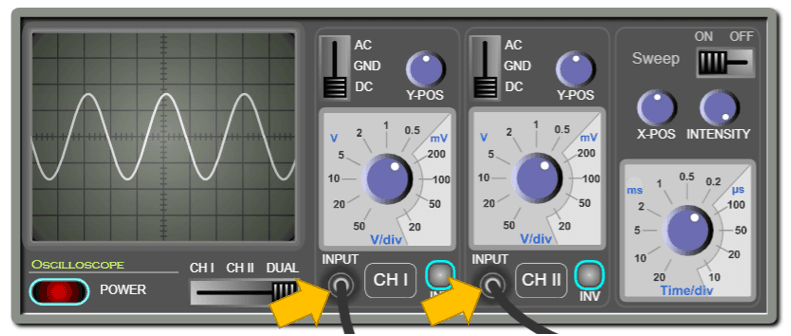
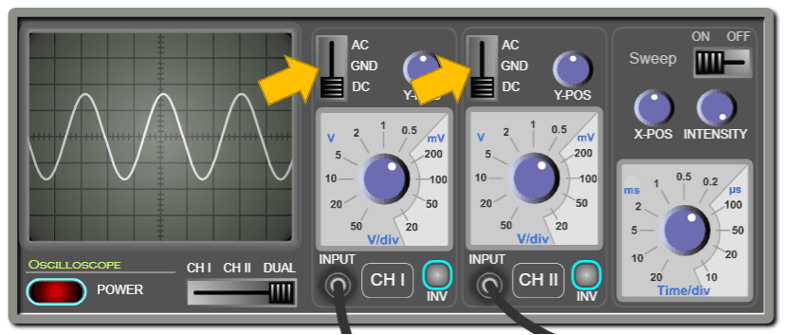
AC/DC/GND Selector: When this is set to “AC”, the DC part of the signal is filtered out. When the selector is set to ground “GND”, the screen will display zero volts. This is used for calibrating the zero level of the display. When the selector is set to “DC”, the entire signal will be displayed.
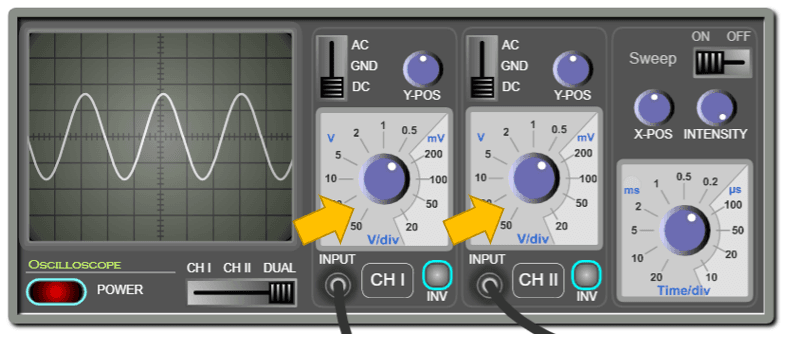
Vertical sensitivity: Each channel has its own vertical sensitivity, which is the scale to which the input signal is traced on the screen. In other words, it determines how many volts are represented in a vertical division.
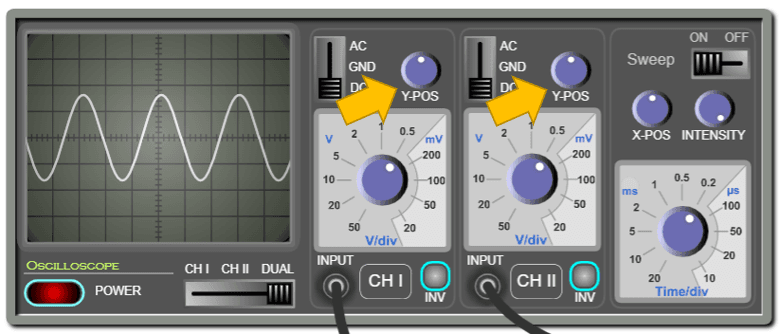
Y-Position: Each channel has a knob for displacing the signal upwards or downwards. This is useful in the measurements and comparison of signals.
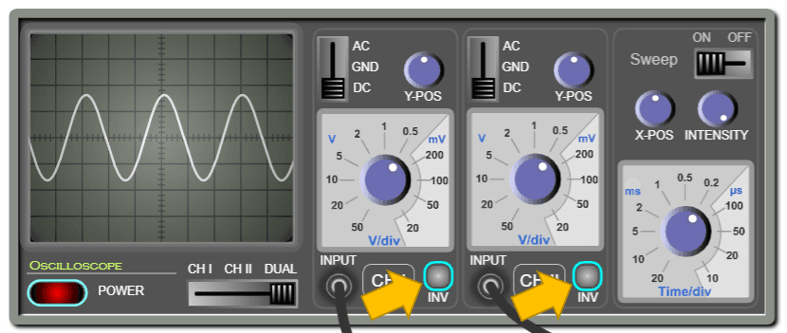
Invert button: This is used to invert (flip) the signal vertically.
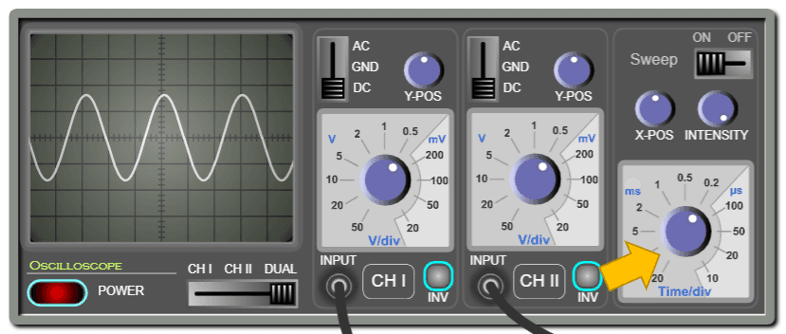
Horizontal sensitivity: Use this knob to change the time scale on the horizontal axis. In other words, this determines how many milliseconds or microseconds are represented in a horizontal division.
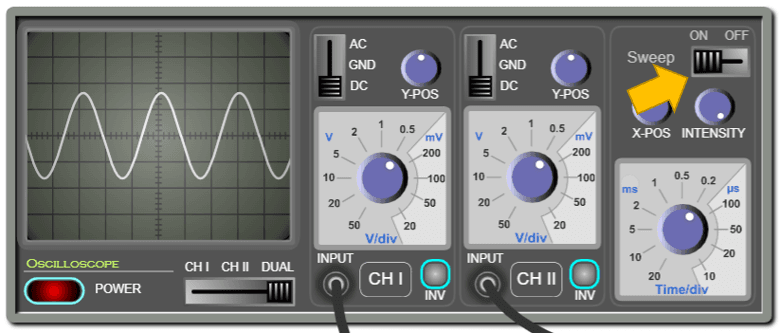
Sweep button: this is used to turn ON/OFF the sweeping. If the sweep is OFF, the screen will display a luminous dot. Otherwise, it will display a curve.
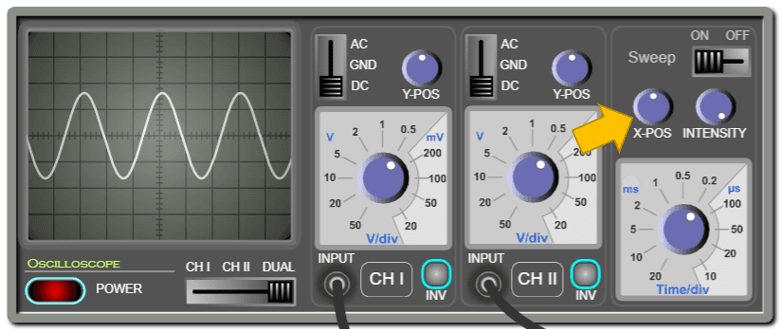
X-position: Use this knob to displace the waveform horizontally to the left or the right. This is useful in measurement.
Intensity: Use this knob to control the intensity of the luminous lines displayed on the screen.
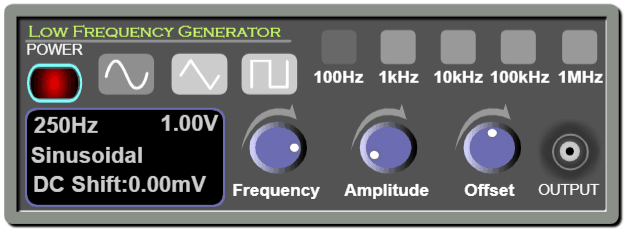
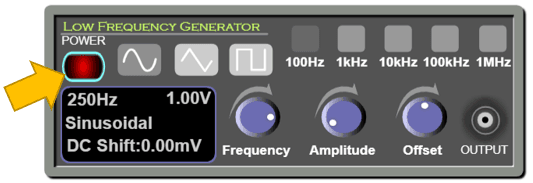
Low Frequency Generator: This instrument supplies three types of electrical signals: sinusoidal, triangular, and rectangular (or square signal). The frequency, amplitude, and DC offset can be adjusted.
ON/OFF switch: This is used to turn on or off the Low Frequency Generator.
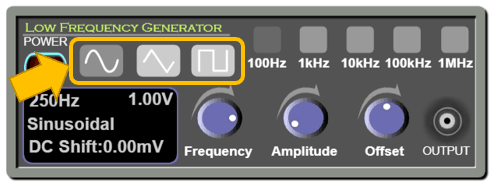
Type of signal: press one of these buttons to select one of the following output signals: sinusoidal, triangular, or rectangular.
Frequency knob: You can rotate this knob to vary the value of the frequency of the output signal.
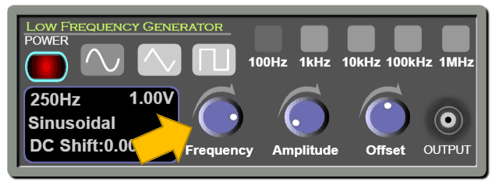
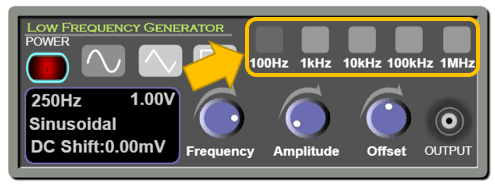
Frequency ranges: You can select a range so you vary the frequency accordingly using the frequency knob.
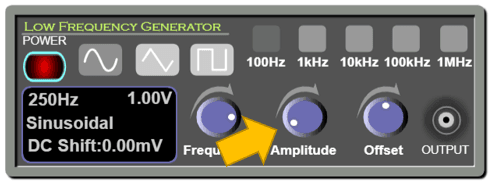
Amplitude knob: You can rotate this knob to vary the value of the amplitude of the signal.
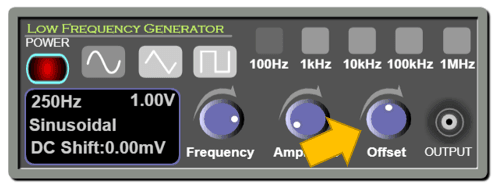
DC Offset knob: You can rotate this knob to vary the DC offset of the output signal. A DC offset is a constant voltage value added to the signal.
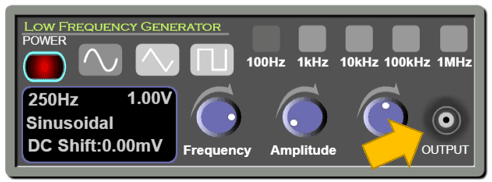
Output: This is where we must connect the wire to get the output voltage from the generator. Note that it is coaxial.
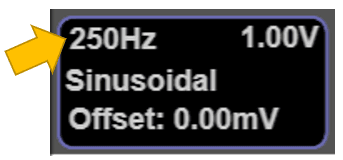
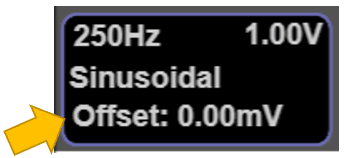
The screen of the low frequency generator: This is where the information about the output signal is displayed.
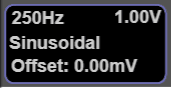
This displays the frequency of the output signal in hertz.
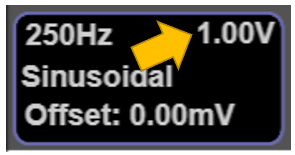
This displays the amplitude of the signal in volts.
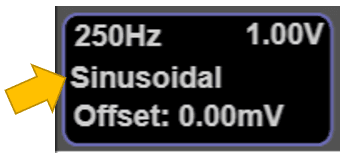
This displays the type of signal (sinusoidal, triangular, or rectangular).
This displays the DC offset of the signal in volts.
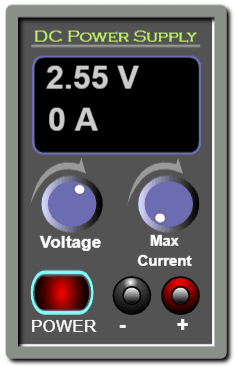
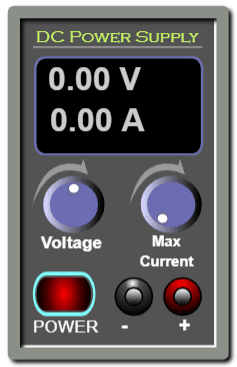
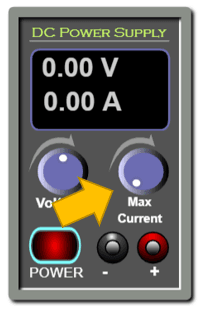
DC Power Supply: This device delivers a constant adjustable voltage.
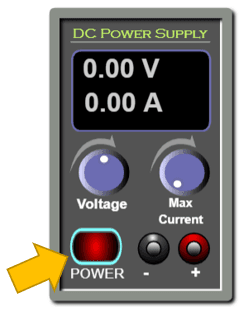
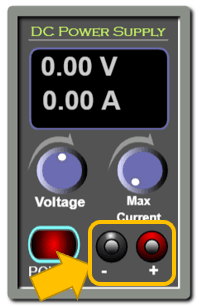
ON/OFF switch: This is used to turn on or off the DC power supply.
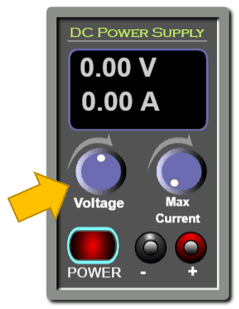
Voltage knob: Rotate this knob to vary the output voltage.
Maximum Current: This knob is used to limit the output current. In this experiment you will never need it since the input impedance of the oscilloscope is extremely high so it acts as an open circuit and drives almost no current from the DC power supply.
Output: this is where the connecting wires are connected.
The screen of the DC power supply: This is where the information on the DC signal is displayed.
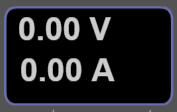
This displays the value of the output voltage in volts.
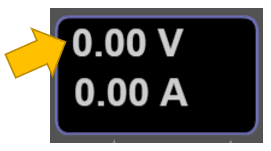
This displays the value of the maximum output current in amperes.
Conclusion:
With this simulation, which is rich in controls and visuals, the learner can observe and practice measuring the phase difference between two waveforms on the oscilloscope. She can also determine the speed of sound in air. And with the proper instructional methodologies, the instructor will be able to empower the sense of discovery in the learners and introduce the concept of synchronization of sound waves and how to measure the speed of sound in a clear and visually rich presentation and enable the learners to acquire the required learning objectives.
It is worth mentioning that this simulation is coded with the latest HTML5/JavaScript web tools.